This tutorial walks through the basic steps required to create a sense-and-send network that measures environmental parameters (light levels) and collects measurement results on a gateway computer.
Then, complementary capabilities for quick-and-limited real-time visualization are demonstrated.
The tutorial concludes with a brief demonstration how a fault detection algorithm can be used to detect abnormal measurement values. The algorithm is based on principal component analysis (PCA).
Table of Contents
Setup
Preliminaries
In this tutorial, we are going to work with real hardware nodes - five Zolertia Z1 motes. If you don’t have access to hardware, you can try to follow by executing the application in simulator, but take into account:
- The communication between the system and simulated sensor nodes is a bit different from its communication with real sensor nodes. In particular, firmware reprogramming step is required only for the real nodes; simulations are simply reloaded.
- The “wired runtime” option has not effect on networks running in simulator; all simulated networks are assumed to have wireless control plane.
- The simulator does not attempt to simulate realistic sensor readings. You need to write you own or search for existing plugins on the Internet; see here for a simple example, and here for an advanced example).
The physical setup of this toy test network are five nodes all connected via USB cables to the localhost. The nodes are also equipped with light sensors:
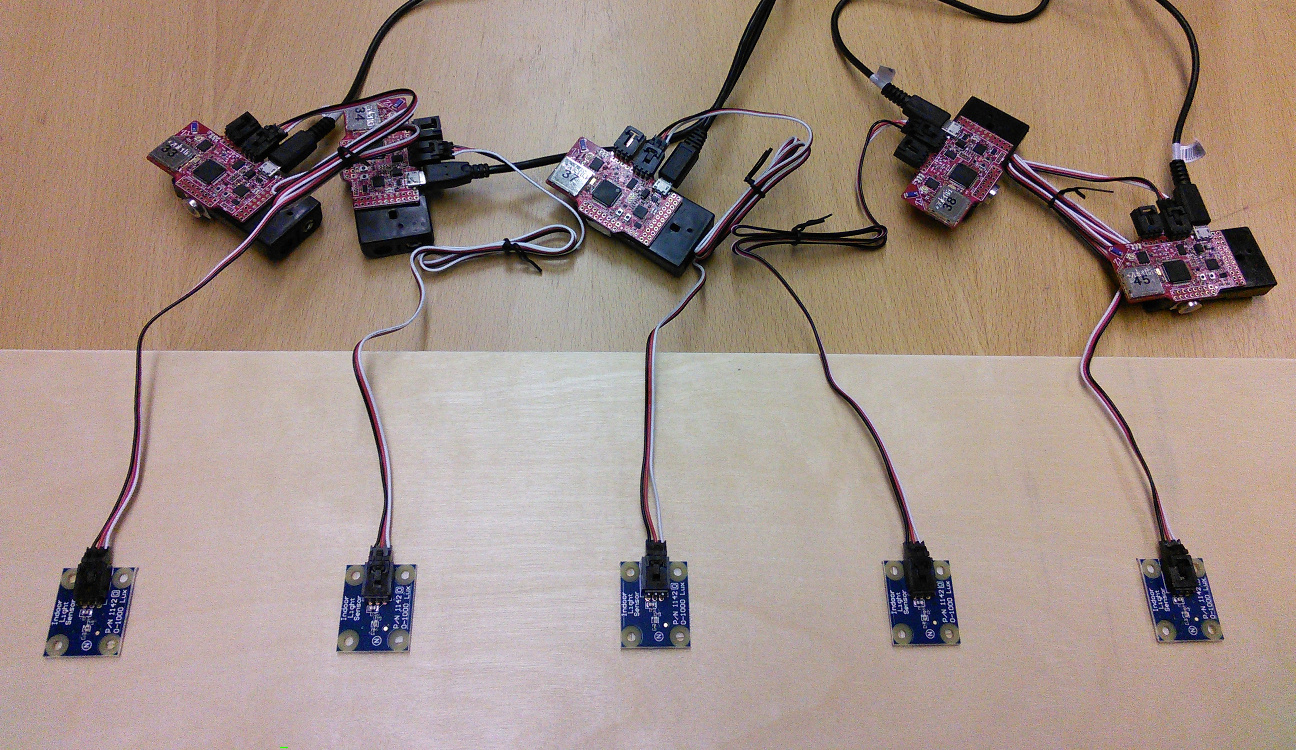
Note that connection to a PC / a router is only required for reprogramming the nodes; other operations can be done wirelessly (creating the tasks, collecting data). Furthermore, the system can be distributed; this means that nodes don’t have to be connected specifically to the local PC, but can be attached to some other systems, e.g. Raspberry Pi boxes or Linux-based wireless routers. On these systems the gateway deamons the should be run. The addresses of these remote systems then should be specified in the visual frontend and configuration files.
Task graph
Add two tasks: light sensing task and data collection task. Tell that the the temperature task must be mapped on every node in the network (specify “perNode” frequency). The data collection task is going to automatically inherit properties from the task its connected to; see the next tutorial for details.
The result:
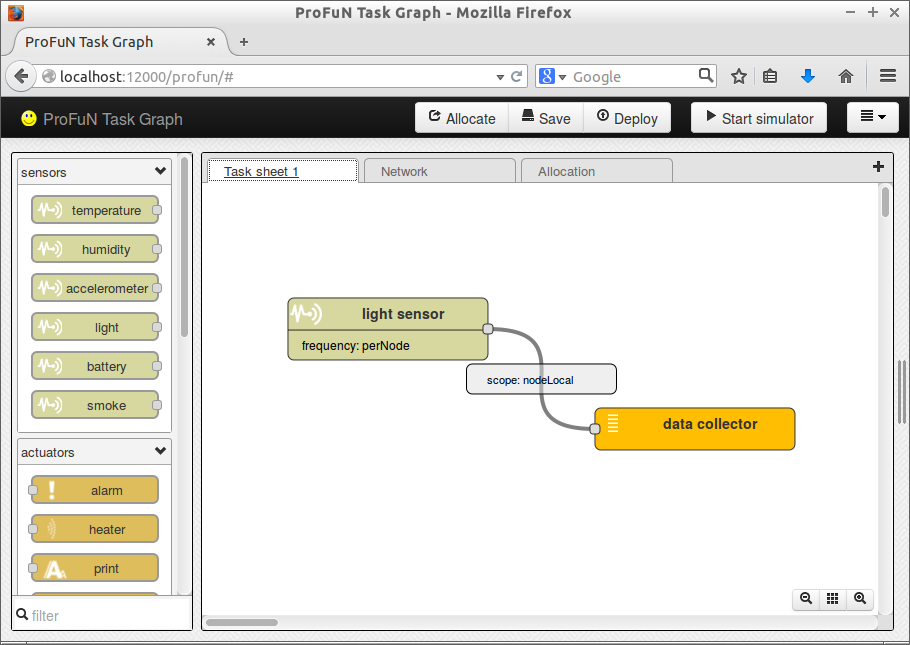
Essentially, connecting a data stream to the data collection task says “I want to receive this data stream from the network”. The collect task takes its incoming data and forwards it to gateway server. In practice, the forwarding means one of these two things:
- if the node is connected via serial or USB cable (i.e. has wired control plane), the data item is simply forwarded to serial port;
- if the node is not directly connected, the data is forwarded towards a gateway node using Contiki collect protocol.
Network
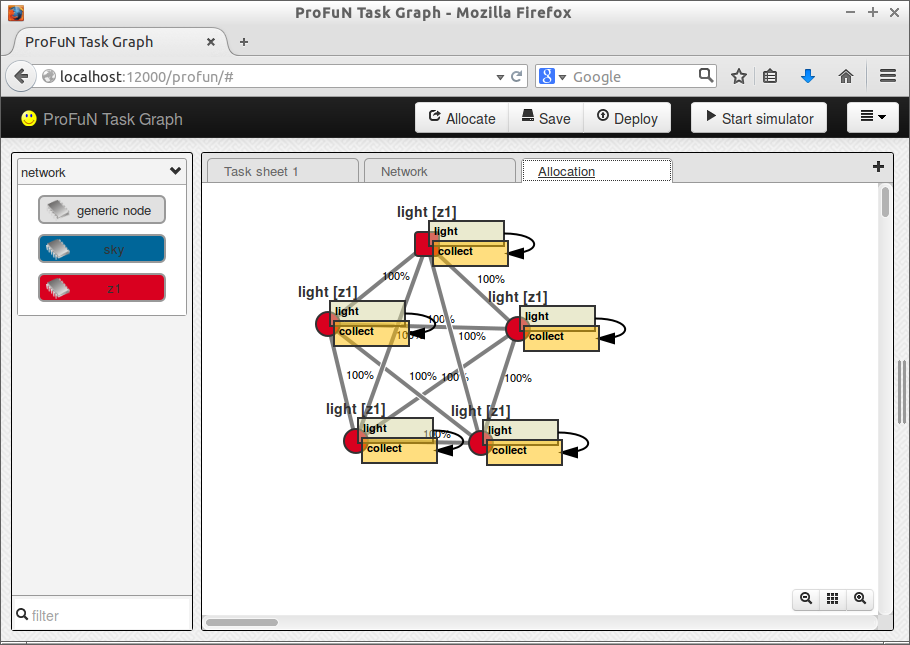
Draw five sensor nodes. No node-to-node data traffic will be present in this scenario, so the links between them are not important.
In this example design, full graph connectivity is assumed:
Running it
Gateway server
A gateway server in the ProFuN TG system is a Python daemon that has one-to-one relationship with a mote connected through serial port (USB cable). The code for that daemon is available at profun/scripts/gateway.
A single instance of a gateway server only talks to a single mote; it is going to try to reconnect to that mote when connection is lost. This dedicated relationship simplifies the design of the system.
If “Wired infrastructure” configuration option is turned on (in the visual interface), the server assumes that the rest of the nodes have their own gateway servers. So it only sends management commands directed to its own connected mote. Otherwise, the tool sends commands for all motes in the network. The directly connected mote is expected to forward these commands.
The functions of the server are twofold: first, it issues management commands to the nodes in the network. Second, it collects data from network nodes.
The server receives the task graph from the visual frontend when the user presses “Deploy” button. The server uses this model to construct a list of commands to be sent to the server. For example, if a completely new model is received, all tasks in that model must be created anew in the sensor network. So the server sends multiple “Add task” commands to nodes in the network. If, on the other hand, a modified version of an already processed model is received, the gateway server compares it with the older copy and creates (or removes) only the tasks that have changed.
The second function of the server is to receive reply messages from serial port, parse them, and store the extracted measurement values. The gateway sensor nodes sends messages of different types: heartbeat messages, acknowledgements, and data messages.
This example data stream contains two heartbeats (T=H, Heartbeat) and two data messages (T=D, Data):
recv: T=D A=38.0 F=3 V=85,1a
recv: T=H A=38.0,c4
recv: T=D A=38.0 F=3 V=83,1a
recv: T=H A=38.0,c4
The second element of each message is the address (38.0) of the originator node. The data messages also have a parameter F (Function) that encodes the type of the task that has created the data item (in this case, 3 identifies the light sensing task), and parameter V (Value) that holds the raw value of the reading. Finally, all messages end with two ASCII symbols that encode 8-bit CRC checksum of the string.
Trying it out
First, connect the motes to your computer. Then create a configuration file specifically for each mote; then, start a server instance for each, passing the name of that configuration file as a command-line parameter.
An example configuration file is available (profun/scripts/gateway/config.json):
{
    "httpPort" : 12100,
    "serialPort" : "/dev/ttyUSB0",
    "moteSerialID" : "Z1RC0353",
    "serialBaudrate" : 38400,
    "moteAddress" : "45.0",
    "daemonize" : false,
    "logLevel" : 2,
    "logFile" : "log.log"
}
A configuration file is required to contain at least the name of the serial port to which the mote is connected. However, it is recommended to also specify the serial ID of the mote. The name of the port can change after reconnecting or system reboot; the serial ID is permanent. Incase the two values are conflicting, serial ID takes precedence.
To find out the serial ID of a connected mote, run motelist script. (If you have Zolertia Z1, use motelist-z1.) The scripts are distributed with the source of the ProFuN TG, and can be found in contiki/tools/sky/ and contiki/tools/z1/, respectively.
The second step is to test the server from the visual frontend. For each node in the network tab specify these two configuration parameters:
- URL, which is the
httpaddress of the gateway server the node is connected to - Address, which is the RIME address of the node.
If any of these are omitted, the frontend does not attempt to deploy code or to create tasks on that node.
When you now press “Deploy”, the gateway server node should be reprogrammed. After you press “Allocate”, the mapped tasks should be created in the network, and the gateway server should start receiving data from all collect tasks.
Data processing
The gateway server only collects sensor data in RAM. This data is lost when the server is restarted or shut down. Further, after sufficiently large number of entries are collected, older entries start to be discarded to limit RAM usage.
To store the data in a database or a cloud, as well as to process and visualize it, a different set of tools is needed. The ProFuN TG comes with a small set of such tools for demonstration purposes. However, we assume that in real-world use cases third party software is going to be used for these tasks, for example, SicsthSense.
The role of the gateway is to make the recently collected data easily available. The data can be collected through HTTP GET requests: see the how-to guide and Python source code for details.
A simple demo tool for data processing is available at profun/scripts/process. It collects data, computes the average value for each kind of sensors, and optionally runs a fault detection algorithm to detect outliers in sensor readings.
The tool uses configuration files similar to those of the gateway server. For example, this file instruct the tool to collect light sensor data from five gateway server instances running on localhost, with 1.0 second interval:
{
   "httpPort" : 12200,
   "dataSources" : ["http://localhost:12101",
                    "http://localhost:12102",
                    "http://localhost:12103",
                    "http://localhost:12104",
                    "http://localhost:12105"],
    "sensors" : ["light"],
    "queryInterval" : 1.0,
    "daemonize" : false,
    "logLevel" : 2,
    "logFile" : "log-light5-local.log"
}
Visualization
In the folder profun/scripts/graph there is a very simple visualization script that is based on Google visualization API. It can be run locally - simply direct your browser to file:///PATH_TO_PROFUN/scripts/graph/graph.html.
The graphing scripts to the processing script that is assumed to be reachable at http://localhost:12200.
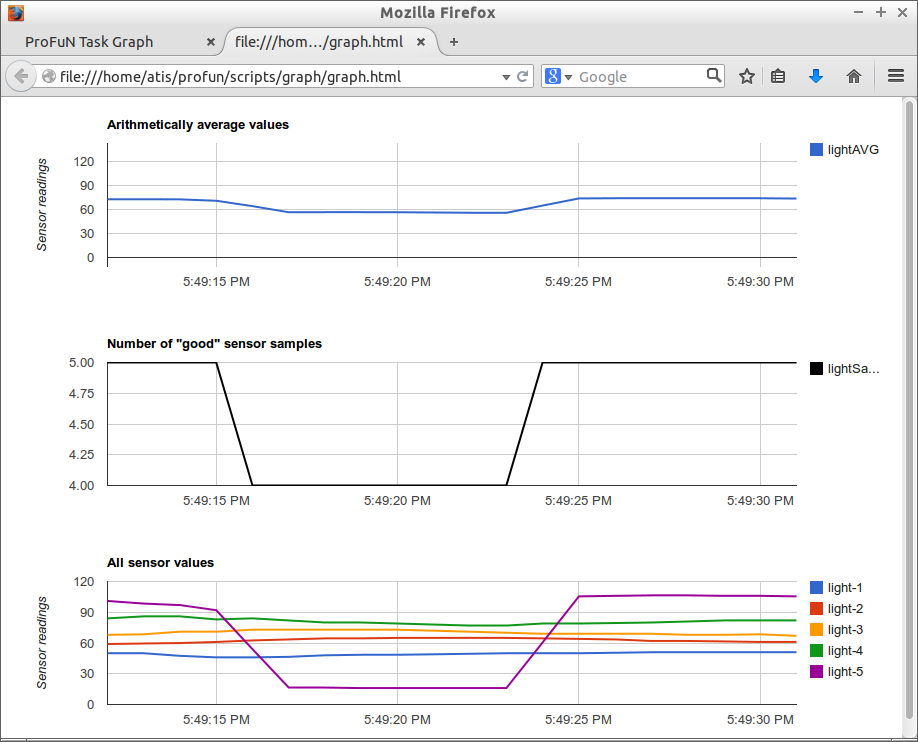
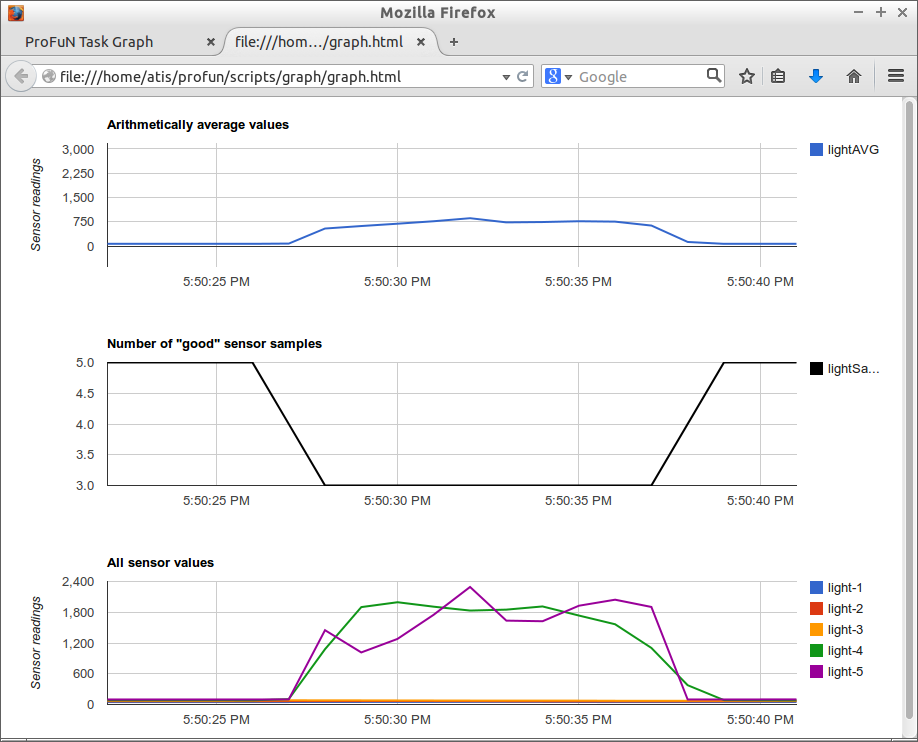
It demonstrates the values received on three graphs:
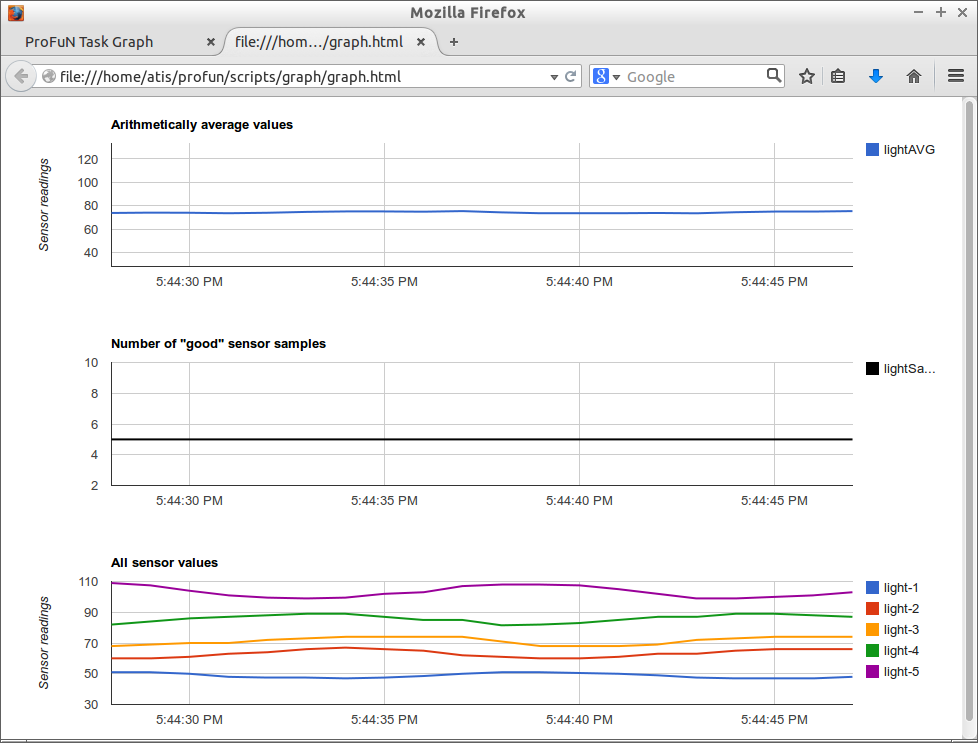
The first graph displays the average values for all types of sensors. Since here we have only one type of sensors - light - only one value is displayed.
The second shows the number of sensors of each type that are actually used. A sensor may produce data, but still not be used. In particular, sensors whose readings are detected to be faulty / unreliable are not included.
The third demonstrates readings of individual sensors. All active sensors are going to be included here, even those not included in the computation of the average value.
Fault detection
Light data measurements are extremely fragile. In real-world conditions, some of the sensors may easily get dirty, and as a consequence produce unreliable data. Other sensors may accidentally get covered. A sensor that is supposed to measure only the light from natural sources are going to produce invalid data in case artificial lighting objects are installed in vicinity.
In short, it’s very easily to introduce “crazy”, non-natural readings in a light sensing network. Furthermore, its not so easy to detect these readings with simple threshold-based methods, as light levels naturally show great variance over time.
An idea how to circumvent this problem is to use a non-parametric approach. The advantages of non-parametric approaches lie in the fact that the user does not have to specify explicit parameters (such as thresholds) to use it. Instead, these approaches work by building a model based of past data, and then using this model to check whether the fitting error of the current data to this model is acceptably small.
The process.py tool uses a combination of Squared Prediction Error (SPE) and T2 tests to detect abnormal variance of some sensors. The tests are run on the principal components extracted from the data.
Here the algorithm detects a fault when one of the sensors is covered by hand (close to zero readings for a short time):
Here the “hump” corresponds to two sensors being lit from a mobile phone flashlight:
Be warned though: PCA approach assumes linear correlations of the observations. For many light measurements, especially indoor measurements, most of the “interesting” correlations are going to be nonlinear. Nonlinearity can be handled through mathmematical tricks, for example, by artificially increasing the number of dimensions in the data, but this topic is too broad to be discussed here.
Download
The resulting model file is available here.