Table of Contents
Overview
One of the key features of ProFuN Task Graph is the option to set user defined end-to-end constraints between a pair of communicating tasks. These constraints serve two roles: the predictive and the diagnostic.
-
The predictive role: the task allocation algorithm takes into account these constraints, and will not produce mappings that violate the constraints.
-
The diagnostic role: the runtime system checks if the conditions of the constraints are met. If this test fails on a node (for example, the node does not receive the expected proportion of packets), that node notifies the central system, which then re-allocates the tasks.
To elaborate the point and avoid misunderstandings, the role of ProFuN Task Graph is primarily to facilitate the integration of already existing methods and tools to the task mapping process, such as statistical prediction techniques, and dependability reassurance methods. The guarantees produced by the tool are only as good as the models used to produce them, and the models are primary the user’s own responsibility, especially at this point. We plan to extend the next version of the tool with an automatic model-creation capability from the statistics gathered from the network during run-time, but even that is likely to require some tuning to produce good results for a specific deployment. There is no complete workaround to the fact that predicting the performance of a wireless network is difficult. At the same time we plan to facilitate it by using more predictable network protocols such as Low Power Wireless Bus.
Checking that a constraint fails
Detecting lost packets and large delays is usually quite simple, so it can be done on sensor node hardware. (In contrast, the predictive and task-mapping part should be done by a powerful, energy unconstrained processor). For an example, consider constraints such as “at least 96% packet delivery” or “at most 3000 millisecond delay” between two specific tasks. To check that these constraints are met, runtime system collects statistics about all sent and all delivered data packets between tasks, including the delay between send time and reception time. Periodically, the system compares these statistics with the user-defined thresholds. If any of these thresholds are violated, the system signals a failure by sending an alert message to the base station.
To see this in action, open ProFuN TG, and load reallocation model (through “Import tasks…” -> “Library” menu items).
The model contains a very simple task graph (two communicating tasks) and a network with four nodes - gateway, an actuator, and two nodes with sensors.
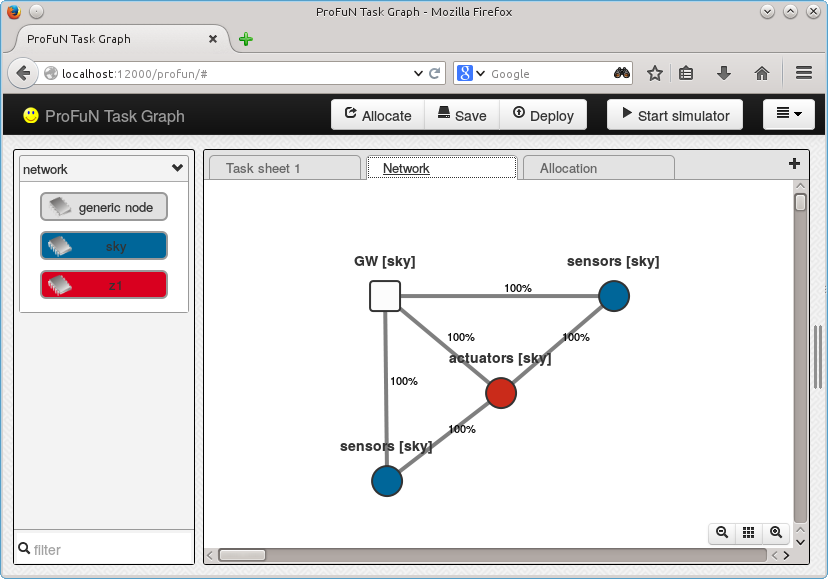
The point of this example is to show how a sensing task is going to be remapped on another node after it fails to deliver a sufficient amount of packets.
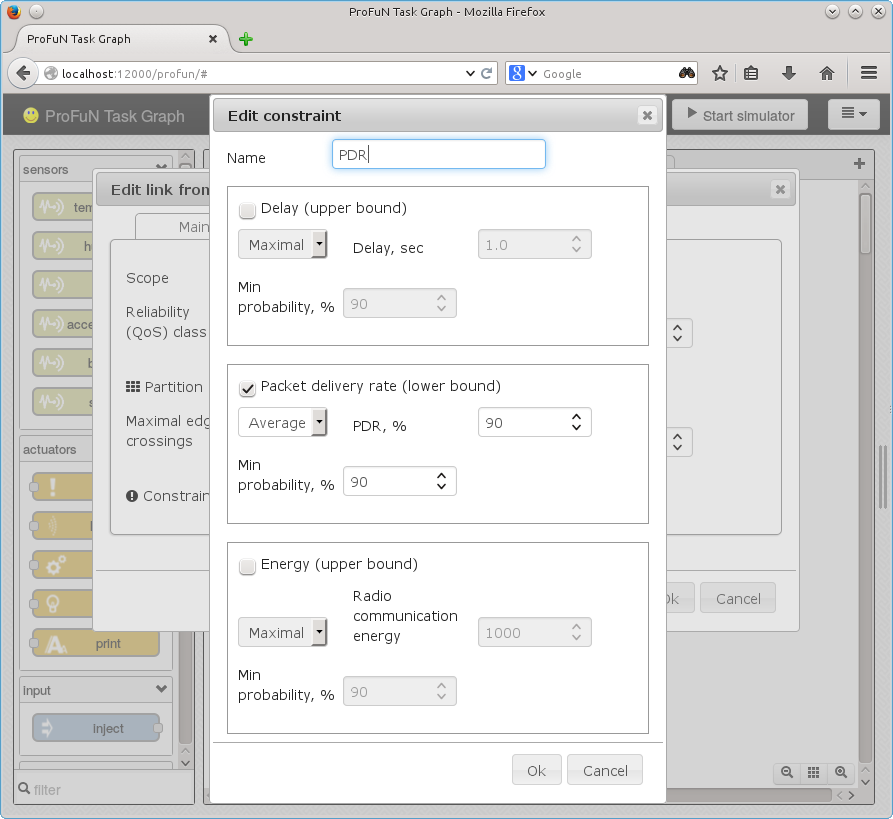
Start with adding an constraint between the tasks. Doubleclick on the link between then to open link configuration dialog. In the dialog, click on the small button right of “Constraint” field:
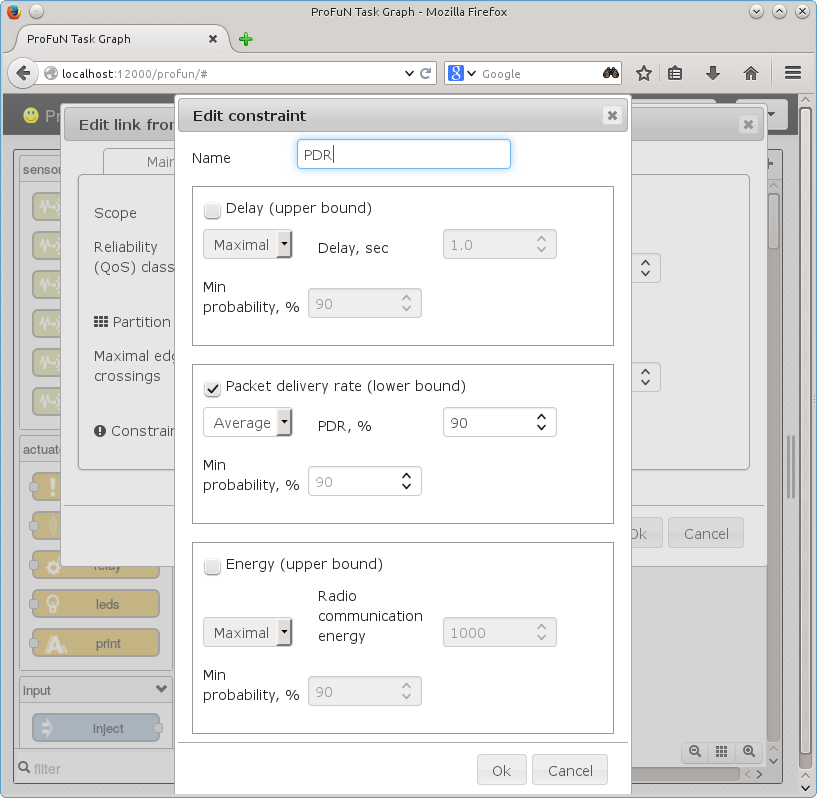
We will make this a contstraint on packet delivery rate; constraints on end-to-end delay are also supported. For the future, support for other variables such as energy consumption are planed. Check the checkbox at the left side and fill the “PDR, %” field with a value. (Leave “Min probability” field empty for time being.)

Now the name of the constraint should be visible on the dataflow link between tasks.
Allocate tasks and start the simulator. (The order of these actions is not important.)
For simplicity, set all of the network links to 100% reliability, so that packet delivery never fails because packet loss in the physical level, and assuming a network stack implementation that does not drop any packets, the constraint should always be satisfied.
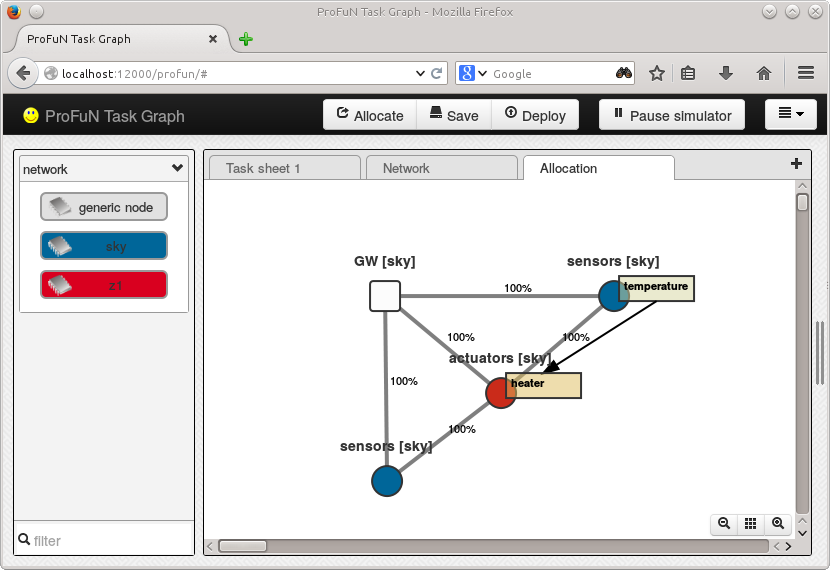
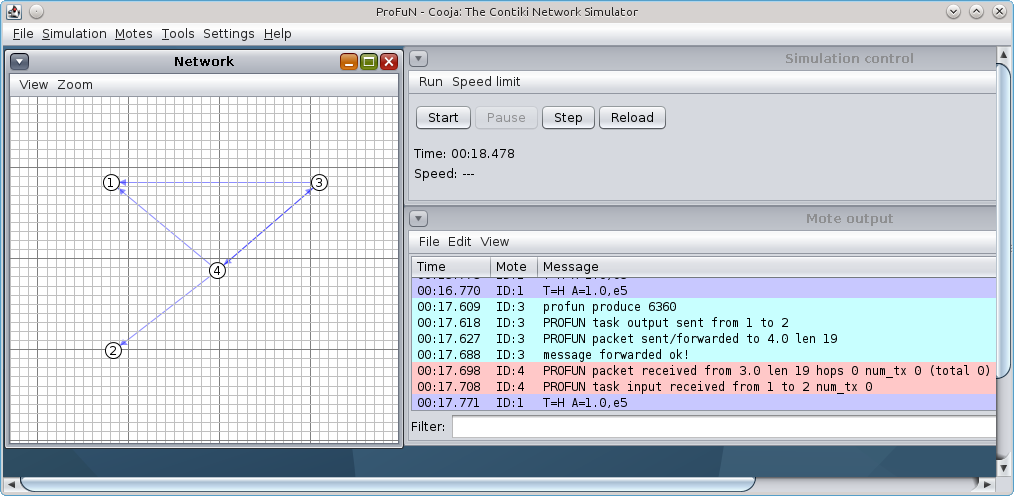
After a while, the simulator should show that data is flowing between the tasks:
Now start moving away the node on which the temperature sensor is mapped. Move it until the link that connects it with the actuator node disappears. Then wait for a few seconds. The runtime system should detect the problem and reallocate:
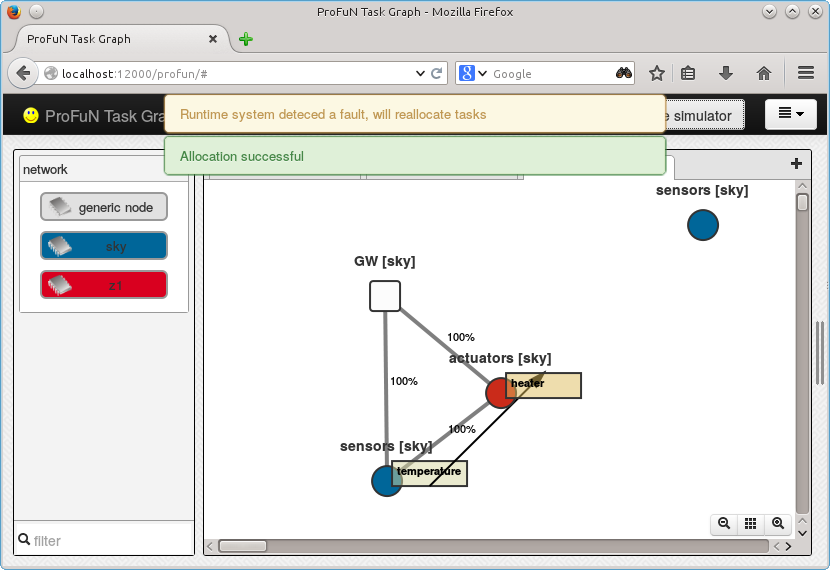
The connection between the tasks should continue to function as before. However, note that the first sensor node is still sampling temperature sensor and trying to send the value to the actuator node. If you move if closer back to the actuator node, the actuator is going to receive these messages, but should just ignore them.
Predicting the number of task copies needed
In general, a single pair of communicating tasks may not able to reach high PDR and delay guarantees due to the inherent unreliability of wireless communications. Even though fading effects can be avoided by overallocating the link budgets (i.e. making sure the nodes are sufficiently close to each another), destructive interference always remains a possibility, especially interference from external networks.
A simple way how to increase the reliability is to include redundant tasks in the network. The number of such tasks should be the minimally required for acceptable performance. (We don’t want to waste energy and produce extra traffic if it’s not required.)
Load task_autocopies_net_only model. The model contains some redundant sensor nodes:
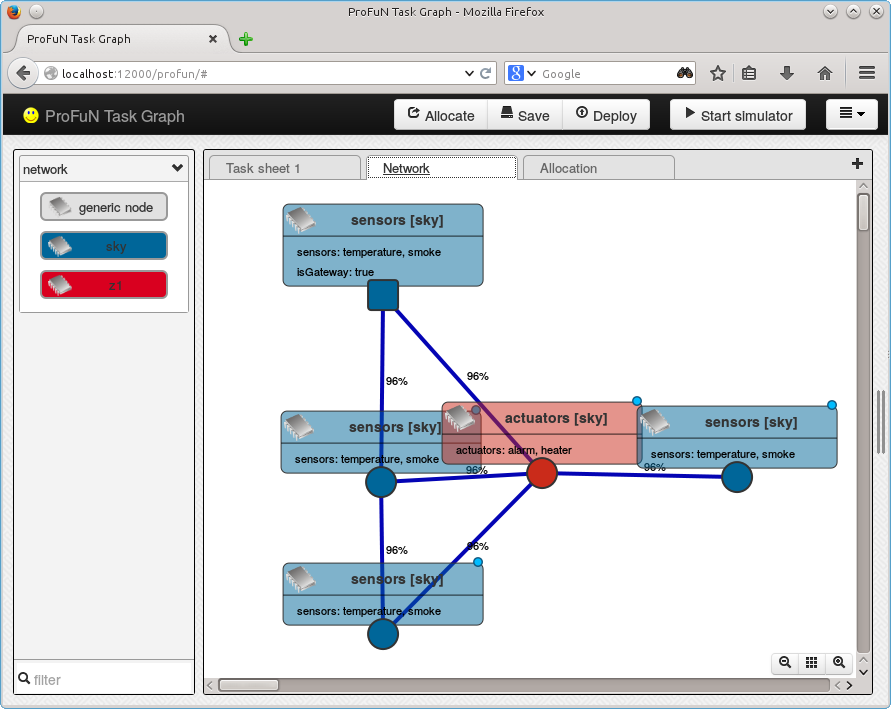
In order to keep this tutorial easy to follow, all the links in the network are manually configured to have normal (Gaussian) distribution of packet delivery rates with 96% mean and one percent-point variance (the configuration string is Normal(0.96, 0.01)).
Configure a pair of tasks, for example, a smoke sensor and alarm actuator. (Typically, one would like his smoke-sensing system to be reliable!)
Configure a PDR constraint between these tasks. Start with 90% target PDR and 90% minimal probability:
Can a single smoke sensor achieve this probability in this network? To do that the tool calculates the CDF (cumulative distribution function) of this normal distribution at value 0.90 (the target PDR). The value CDF(0.90) ≈ 0.000000001 happens to be much smaller than 10% (the maximal acceptable probability of failure), so the mapping is accepted.
Now change the expected value to 96%. It is clear to see that in this case the constraint cannot be satisfied by the same mapping. The expected value of PDR through a single-hop path is 96%, i.e. the probability of having more than 96% is just 50%, not the minimally required 90%: CDF(0.96) = 0.5 > 0.1
So now the tool creates duplicated copies of the sensing tasks. Assuming that the delivery probabilities are independently and identically distributed (i.i.d. - as is often the case when non-overlapping communication channels are used for the distinct tasks), the probability of at least one task delivering the data is significantly larger than the probability of a single task delivering the data.
To find the minimal number of copies tasks required for 90% success probability, in this particular case we need to solve the equation:
CDF(0.96)^x = 1 - 0.90
0.5^x = 0.1
x = log_0.5(0.1)
x = 3.321928094887362
Since the number of tasks is required to be a nonegative integer, the answer is four: ceil(x) = 4
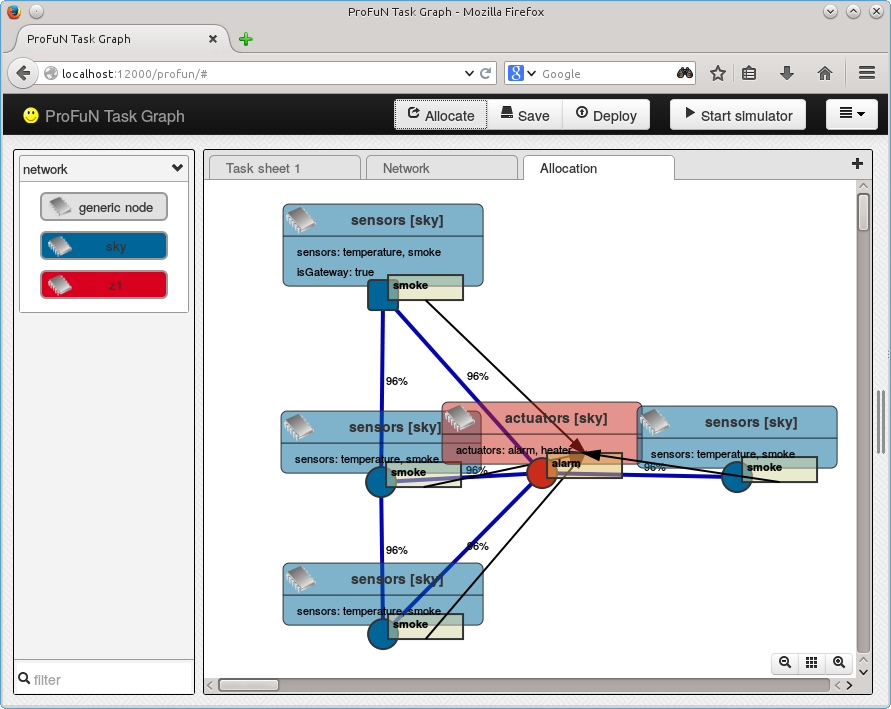
The result: when allocating tasks under this constraint, the tool creates not just one, but four copies of the sensing task.
Download
The models for this tutorial are available in the library of examples: reallocation and task_autocopies_complete.